Answering questions and finding insights to drive decision making is the key value that behavioral data unlocks. And until now, our customers have had to construct charts step-by-step in the UI. Though this was already leaps and bounds easier than writing SQL, there were still many steps involved (what type of chart do I build, what events do I need, what properties or groups do I use, and so on).
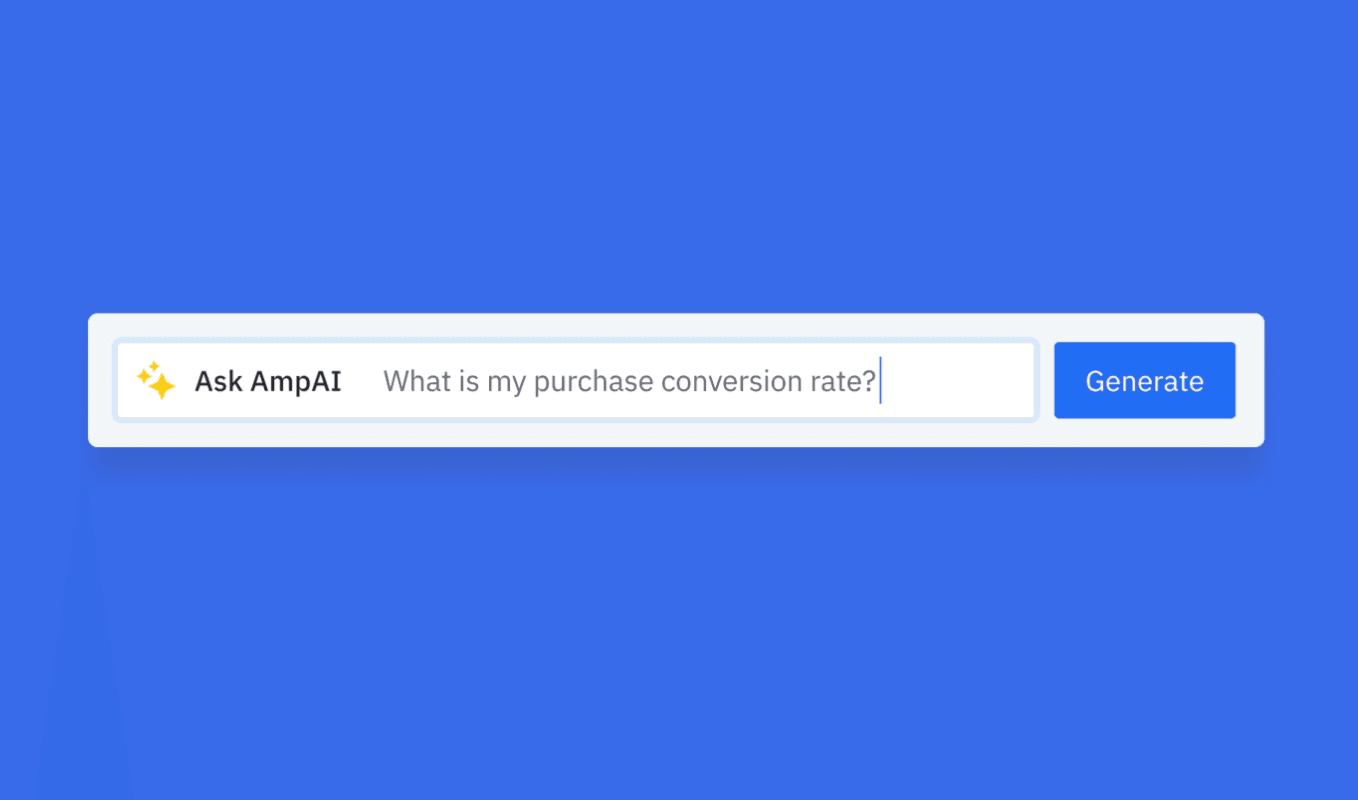
We’re excited to announce that we’ve created an AI assistant to empower you in the chart-building process. You can now shortcut the “building” process and go straight from a question to an insight. Amplitude customers can try it out today.
Here are some questions it can help you answer:
- Which category has the highest rate of purchase after viewing a recommended item?
- What is the average length of sessions where users play at least five songs?
- How long does it take for companies on free vs paid plans to invite their first three users?